Demark Trend Lines several time frames
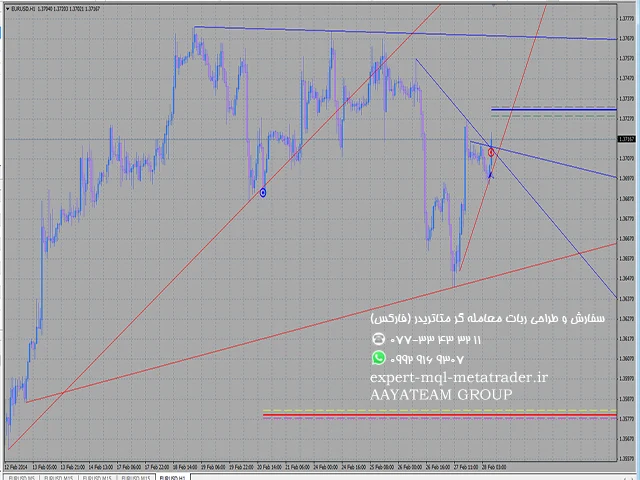
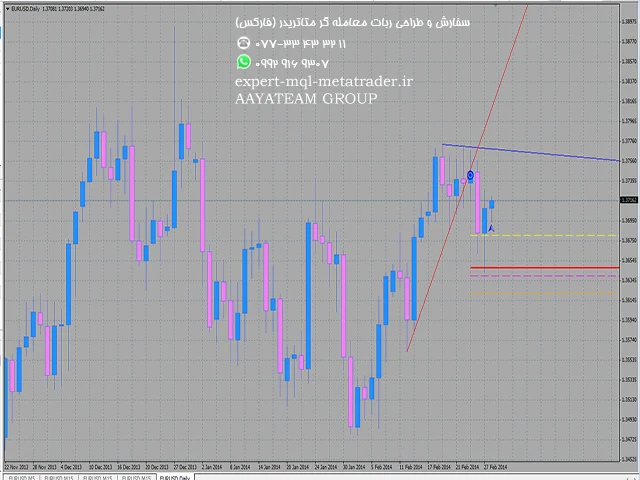
این شاخص بر اساس الگوریتم توماس دمارک خطوط روند را ترسیم میکند.
این خطوط را از بازه های زمانی مختلف بر روی یک نمودار ترسیم میکند. بازه های زمانی میتوانند بیشتر یا مساوی با بازه زمانی نمودار باشند که از شاخص در آنها استفاده میشود.
این شاخص مقدمات دستیابی به موفقیت را در نظر میگیرد (در صورت برآورده شدن شرایط ، یک نماد اضافی در محل پیشرفت ظاهر میشود) و طبق الگوریتم Demark اهداف تقریبی (خط هدف بالاتر/زیر قیمت های فعلی) را ترسیم میکند.
بازه های زمانی توصیه شده برای معاملات D1+H1 است.
خطوط روند سایر بازه های زمانی ممکن است اطلاعات بیشتری برای ارزیابی وضعیت بازار ارائه دهد.
Demark Trend Lines several time frames
The indicator draws trend lines based on Thomas Demark algorithm.
It draws lines from different timeframes on one chart. The timeframes can be higher than or equal to the timeframe of the chart, on which the indicator is used.
The indicator considers breakthrough qualifiers (if the conditions are met, an additional symbol appears in the place of the breakthrough) and draws approximate targets (target line above/below the current prices) according to Demark algorithm.
Recommended timeframes for trading are D1+H1.
Trend lines for other timeframes may provide additional information for assessing the market situation.
تماس و واتس آپ اکسپرت سفارشی: ۰۷۷۳۳۴۳۳۲۱۱ – ۰۹۹۲۹۱۶۹۳۰۷