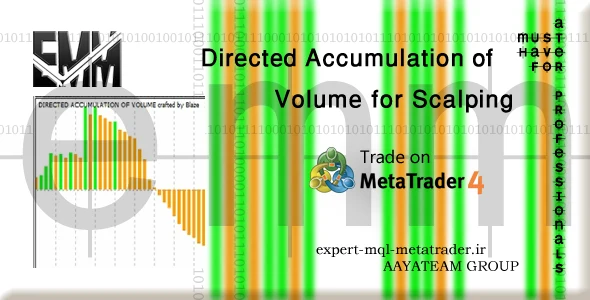
Directed Accumulation of Volume for Scalping
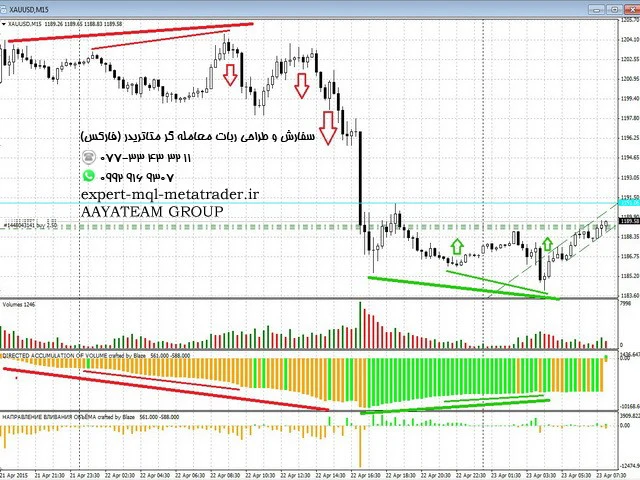
انباشت جهت دار حجم برای اسکالپینگ نشان میدهد که کدام روند مستعد است. منتظر واگرایی شاخص و قیمت برای ورود به بازار باشید (واگرایی به معنای وضعیتی است که قیمت در حال رشد است یا کاهش نمییابد و شاخص در حال سقوط است).
تصویر زیر نمونه ای از ورود SELL را نشان میدهد.
برای وارد کردن موقعیت BUY کاملاً برعکس عمل کنید.
ایده ایجاد چنین شاخصی وقتی به ذهنم رسید که متوجه شدم واقعا چه چیزی قیمت را تحریک میکند – حرص و ترس و تقویت امید. حرص و آز ما را وادار میکند تا زمانی که یک روند فعلی مشهود است ، موقعیتی را باز کنیم و ترس باعث میشود که موقعیت خود را در صورت ضرر ببندیم ، هنگامی که یک اشتباه آشکار است ، یک اشتباه دیگر!
با تفکر منطقی میتوانیم به نتایج نادرستی برسیم. به عنوان مثال ، اگر همه به بازار بیایند و روند صعودی را ببینند ، همه آنها میخواهند خرید کنند. اما چه کسی میفروشد؟ چه کسی به همان میزان میفروشد؟ قیمت به طور مداوم از روند متاثر از تقاضای جدید پیروی میکند زیرا عمق بازار بالاتر از قیمت فروشندگان کمتر و کمتری دارد و قیمت به راحتی در حال افزایش است. و گاوهای قدیمی سود جدیدی به دست میآورند و حرص آنها را مجبور میکند این سود را دوباره سرمایه گذاری کنند. علاوه بر این ، پیمانکاران آنها موقعیت های کوتاه خود را با ضرر خریداری میکنند. با انجام این کار آنها بازار را خریداری میکنند ، قیمت را بالاتر میبرند ، فروشندگان جدید را پیدا میکنند و قرارداد آنها را با خریدار از دست میدهند … و غیره.
اما واقعیت بسیار متفاوت است. من میتوانم ساعت ها روی این موضوع کار کنم ، زیرا اطلاعات زیادی در مورد آن در ذهن دارم که میتوانم یک کتاب بنویسم. اما من سعی میکنم در اینجا فقط مختصر اطلاعات کلیدی را ارائه دهم.
من فکر میکنم که عموماً شناخته شده است که اکثر بازارها دارای نقدینگی هستند: پول قوی یا هوشمند ، بازارسازان (MM) و غیره. یک نام اصل موضوع را تغییر نمیدهد.
در لحظات خاص ، جمعیت از احساسات قطبی میشود و در یک طرف میماند: همه در یک نقطه موقعیت باز میکنند ، در نقطه دیگر موقعیت میبندند ، در نقطه سوم موقعیت باز میکنند … این است که چگونه پول قوی میتواند این همه نقدینگی را جذب کرده و مثلاً توقف کند. ، حرکت قیمت به سمت بالا باعث خرید بیش از حد داخلی میشود (همه کسانی که قصد خرید داشتند ، خرید کرده اند و هیچکس مایل به فروش نیست زیرا روند صعودی بسیار مشهود است).
حتی چنین اصطلاحاتی در اینترنت وجود دارد: “تجمع” و “توزیع”. این همان چیزی است که من در مورد آن صحبت میکنم. ایجاد خریدهای اضافی محلی در یک لحظه معین (بازه های زمانی مختلف ممکن است در یک زمان وضعیت متفاوتی داشته باشند) پول قدرتمند باعث ایجاد عدم تعادل تقاضا و عرضه میشود که حجم انباشت موقعیت خود را در جهت مخالف ایجاد میکند. شما فقط باید بازار را به اولین توقف ها منتقل کنید و واکنش زنجیره ای به طور خودکار شروع میشود – این یک روند محلی جدید یا عقب نشینی یک روند جهانی خواهد بود ، نامی مهم نیست 🙂
برگردیم به اندیکاتور. در واقع ، دو مورد از آنها وجود دارد. آنها الگوریتم محاسبه یکسانی دارند اما مقادیر متفاوت نشان داده میشوند.
جهت افزایش حجم – حجم هر تیک در داخل هر میله شمع انباشته میشود. حجم با یک نگاه به جهت صعودی یا نزولی این روند اضافه میشود. DELTA پس از بسته شدن هر شمع بین حجم صعودی و نزولی ثابت میشود.
تجمع افزایش حجم – حجم هر تیک در داخل هر شمع جمع میشود. حجم با یک نگاه به جهت صعودی یا نزولی این روند اضافه میشود. پس از بسته شدن شمع ، دلتا با یک نگاه به مقدار آن به مقدار نشانگر نوار قبلی اضافه میشود. پس از این دلتا انباشته ثابت میشود.
Directed Accumulation of Volume for Scalping
Directed Accumulation of Volume for Scalping shows direction a trend is predisposed to. Wait for divergence of the indicator and a price to enter the market (divergence means a situation when the price is growing or is not falling, and the indicator is falling).
- The screenshot below demonstrates an example of SELL entry.
- Do quite opposite to enter a BUY position.
The idea to develop such indicator came over me when I realized what really moves a price — greed and fear fortified by hope. Greed makes us to open a position when a current trend is obvious, and fear makes us to close a position in loss, when a mistake is obvious, ANOTHER MISTAKE!
Thinking logically we can came to wrong conclusions. For example if everybody come to the market and see the upward trend, they all will want to buy. But who will sell? Who will sell the same amount? The price will continuously follow the trend affected by new demand as the Market Depth above the price has fewer and fewer sellers and the price is moving up easily. And old bulls gain new profit, and greed makes them invest this profit again. Moreover their contractors will buy their short positions at a loss. Doing this they BUY following the market, moving the price higher, finding new sellers and transferring them losing contract with a buyer… And so on.
But reality is much more different. I could run on this topic for hours, as I have so much information about it in my head that I could write a book. But I will try to give just brief key data here.
I think that it is commonly known that majority of markets have liquidity providers: powerful or intelligent money, market makers (MM) etc. A name does not alter the essence.
At particular moments the crowd polarizes from emotions and stay at one side: everybody open positions at one points, close positions in another points, open positions in third points… That is how powerful money can absorb all this liquidity and STOP, for example, upward price movement creating local overbought (all, who wanted to buy, has bought, and nobody wishes to sell as upward trend is too obvious).
There are even such terms on the Internet: “accumulation” and “distribution”. That is what I am talking about. Creating local overbought at a certain moment (different time frames might have different situation at a time) powerful money create disbalance of demand and supply accumulating volume of its position in opposite direction. You just need to push the market to the first stops, and chain reaction will start automatically – it will be a new local trend or a pullback of a global trend, a name does not matter 🙂
Let’s go back to the indicator. Actually, there are two of them. They have the same calculation algorithm but values are displayed differently.
- Direction of volume increase — volume of every tick is accumulated inside each bar of candle. Volume is added with a glance to bullish or bearish direction of this trend. The DELTA is fixed between bullish and bearish volume after closing of each candle.
- Accumulation of volume increase — volume of every tick is accumulated inside each bar of candle. Volume is added with a glance to bullish or bearish direction of this trend. After a candle is closed the delta is added with a glance to its value to the value of the indicator on the previous bar. After this the ACCUMULATED delta is fixed.
تماس و واتس آپ اکسپرت سفارشی: ۰۷۷۳۳۴۳۳۲۱۱ – ۰۹۹۲۹۱۶۹۳۰۷